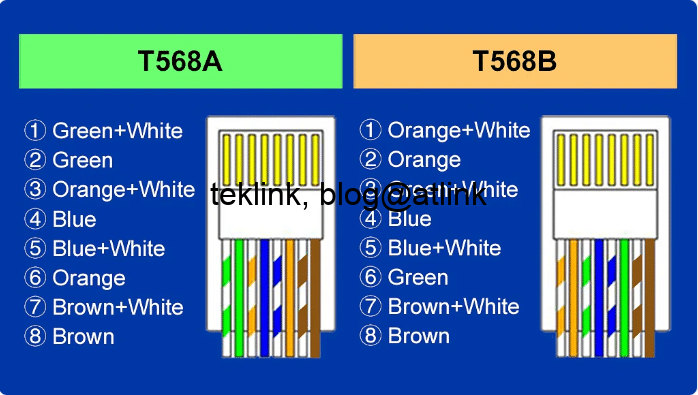
How speed is my Ethernet cable?

1 gig per second operation is described in the ieee802.3ab standard under the designation of 1000base-T over a classe D cat.5 cable of 100 meters lenght maximum and a supported signal frequency of more than 100MHz.

The awg metric measures the quality of the cable. The greater the awg is, the lesser is the attenuation to the electrical signal and better the signal quality…

An awg of 26 is better than an 24 awg cable…

The 1 gig standard allows data transmission over the 4 pairs that compose the Ethernet cable. 2 bits per baud are sent over each pair, using a 5-moment code, simltaneously and in a full duplex operation.

In addition to the cable caracteristics, the how is an RJ45 cable plug is crafted is very important…

For test purposes, let’s craft our RJ45 plug using this wiring (which is not standard)

The arrows designate the electrical polarization of each pair’s signal. Let’s imagine 2 electromagnetic waves with different amplitudes. We suppose that the cross-wire intersection of the waves corresponds to the resultant electromagnetic interference at any point on any wire. Then we see more interfernce when the amplitude of the wave is important.

If we concentrate on the solid blue curve, a point may suffer from solid marron line interference when is signal is positive…

The same happens for the other lines…

What if we separate the solid blue curve from the marron one in this way, shown in the following figure, no interference could occur in between the blue and marron lines…

Now our signal is distinct. But we still need to fit in the 2 other signals. The best fit is to guarantee that at each time the signals are distinguishable either by amplitude or by phase. Also to guarantee the smallest plug form dimension…

What are our possibilities for the 3rd curve?

In A, if we send blue and orange simultaneously the signal may get cancelled. We could imagine a time synchrnization but it would be very costy to maintain a clock…

In B, the effect of the orange wave is applied to both blue and marron curves but in a lessened proportion. At any point and time either the signals are of opposite phase or the amplitude is sufficiently different…

In C, the effect of the orange wave is more on the marron curve that the blue one. This supposes a bigger plug to fit them also…

We retain both B and C configurations and let’s try to fit the last curve (the green). Our possibilities are:

In B1, B2, C1 and C2, the green wave suffers of interference from both the blue and marron curves…

B3 offers a better orange signal interpretation if we imagine this simplification

atlink'admin

Learn More →

Leave a Reply

Translate »